[Semantic Scholar] – [Code] – [Tweet] – [Video] – [Website] – [Slide]
Change Logs:
- 2023-08-27: First draft. This paper appears at ISSTA ’20.
Method
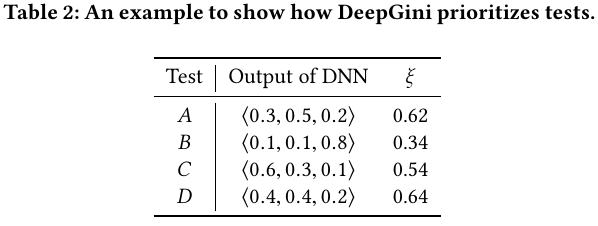
The core of solving a TCP problem is to come up with a metric that correlates to error rates on the the test set. The authors design the metric as follows:
\xi(t) = 1 – \mathbf{p}_ t^T\mathbf{p}_ t
where the \mathbf{p}_ t is the probability distribution of the test t. We could easily parallelize the computation of this metric using \xi(T) = \mathbf{1} – \mathrm{diag}(\mathbf{PP}^T), where \mathbf{P} is a matrix of (n_\text{sample}, n_\text{class}). For example, to reproduce the Table 2 in the paper, we have:
import numpy as np

P = np.array([
    [0.3, 0.5, 0.2],
    [0.1, 0.1, 0.8],
    [0.6, 0.3, 0.1],
    [0.4, 0.4, 0.2]
])

xis = 1 - np.diag(np.matmul(P, P.T))
# array([0.62, 0.34, 0.54, 0.64])
Some comments on this metric:
- This metric is equivalent to entropy as the only different is an additional log term and a scalar.
- This metric is exactly the same as the Gini score used in the decision trees (see
sklearndoc).
Evaluation Metrics
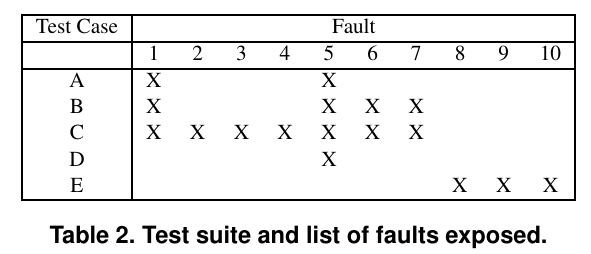
Average Percentage of Fault-Detection (APFD) was first defined in [2], which first proposes the test case prioritization problem. The example below comes from that paper.
Suppose we have a program of 10 known faults and a suite of 5 test cases; each test case is able to detect a subset of faults, then we have the following table:
| A | B | C | D | E | |
|---|---|---|---|---|---|
| Test Suites Used (x-axis) | 1/5 | 2/5 | 3/5 | 4/5 | 1 |
| Faults Detected (y-axis) | 1/5 | 2/5 | 7/10 | 7/10 | 1 |
Then we could compute the APFD with the statistics provided (answer); this answer agrees with what is provided in the paper (Figure 1).
import numpy as np

xs = np.linspace(0, 1, 6)
ys = [0, 1/5, 2/5, 7/10, 7/10, 1]

apfd = np.sum(np.diff(xs) * (ys[:-1] + np.diff(ys)/2))
# 0.5
For machine learning models, the APFD is defined differently as 1 – \frac{1}{kn} \sum_{i=1}^k o_i + \frac{1} {2n}, where k of the total n tests are misclassified, and o_i is the index of the first test that revealls i-th misclassified test.
Experiments
- The experiments in the paper prioritize (1) the original test splits of some image classification datasets, and (2) the adversarial attacked versions of these datasets using standard approaches like FGSM.
- There are two issues with the paper:
- This paper does not consider the OOD test sets.
- The paper tries to augment the training set with the attacked test examples to improve the classification accuracy. It is more sensible to augment the training sets with external annotated datasets.
Reference
- Regression testing minimization, selection and prioritization: a survey (published 2012; more than 1K citations).
- Test Case Prioritization: An Empirical Study (ICSM ’99; ICSM renamed as ICSME in 2014): This paper first proposes the test case prioritization problem and the APFD metric.